AP Weather Station #1 Data
This web page is updated automatically from a weather station located in Arthur's Pass hourly. Graphs are available which show the data at 30 minute intervals over the past 72 hours.
| (Updated on 8/7/26 at 17:02hrs NZST) Refresh Page | |||
|---|---|---|---|
| Station | Latitude | Longitude | Elevation |
| Arthur's Pass | 42º 56' 30" S | 171º 33' 50" E | 730m |
| Today's Weather Data (from midnight to 17:02hrs NZST) | ||||||||||||||||||||||||||||||||||||
|---|---|---|---|---|---|---|---|---|---|---|---|---|---|---|---|---|---|---|---|---|---|---|---|---|---|---|---|---|---|---|---|---|---|---|---|---|
| Almanac | Temperature | Humidity | Barometer | Windspeed & Direction |
||||||||||||||||||||||||||||||||
Sunset 17:15hrs Moonrise 1:53hrs Moonset 12:14hrs |
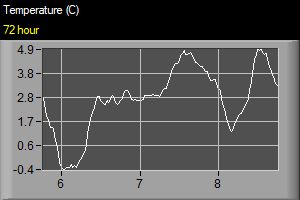
Falling (Graph) Low 1.2ºC High 4.9ºC |
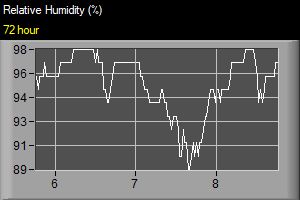
Rising (Graph) Low 94% High 98% |
Rising (Graph) Low 1004.21mb High 1009.05mb |
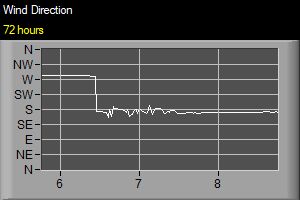
S (Graph) |
||||||||||||||||||||||||||||||||
Moon Phase |
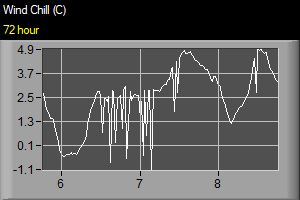
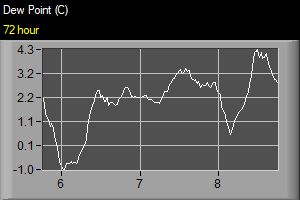
Dew Point | Cloud Base | Windchill | Wind Gust | ||||||||||||||||||||||||||||||||
(Graph) |
(Graph) |
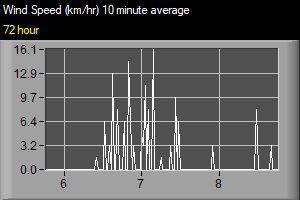
Hour Max 0km/h Day Max 23km/h at 12:14hrs Year Max 111km/h (20/6/26) |
||||||||||||||||||||||||||||||||||
| Conditions at Elevation (Estimated) | Precipitation | |||||||||||||||||||||||||||||||||||
|
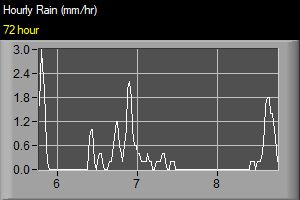
Daily 4.20mm Last Hour 0.80mm Current Rate 0.000mm/hr (Graph) 24hr Rain 4.2 mm Annual 2067.80mm THIS STORM CYCLE (4hrs) Rainfall: 3.8mm High Rain Rate: 1.3mm/hr @ 15:07hrs 8/7/26 Temp Low: 3.6ºC @ 16:57hrs 8/7/26 Temp High: 4.7ºC @ 13:57hrs 8/7/26 Wind Gust: 23kmph @ 12:14hrs 8/7/26 Dom.Wind Dir: North Barometer Low: 1006mb @ 13:57hrs 8/7/26 |
|||||||||||||||||||||||||||||||||||
| Remote Weather Station Records (provided by ECAN with thanks) | |||||||||||
|---|---|---|---|---|---|---|---|---|---|---|---|
| Station | Update Time | Rain Today | -1 Day | -2 Day | -3 Day | -4 Day | -5 Day | -6 Day | -7 Day | Total Rainfall | |
| Arthur's Pass | 08/07/2026 (16:09) | 2.0 | 0.5 | 3.5 | 30.5 | 67.5 | 4.5 | 0.0 | 0.0 | 108.5 | |
| Carrington | 08/07/2026 (16:30) | 2.0 | 0.5 | 11.0 | 31.0 | 131.0 | 15.5 | 0.0 | 0.0 | 191.0 | |
| Grasmere | 08/07/2026 (16:30) | 2.5 | 2.5 | 6.5 | 4.5 | 4.0 | 0.0 | 0.0 | 0.0 | 20.0 | |
| Cheeseman | 08/07/2026 (16:30) | 2.5 | 6.0 | 13.5 | 5.0 | 16.5 | 0.0 | 0.0 | 0.0 | 43.5 | |
| Ranger Stream | 08/07/2026 (14:00) | 1.0 | 4.0 | 13.0 | 12.0 | 29.5 | 0.0 | 0.0 | 0.0 | 59.5 | |
| Upper Wilberforce River | 08/07/2026 (16:00) | 46.5 | 2.0 | 0.0 | 0.0 | 0.0 | 60.5 | 7.5 | 0.0 | 116.5 | |
| Mount Byrne | 07/07/2026 (20:25) | 0.5 | 0.0 | 21.5 | 118.5 | 8.0 | 0.5 | 0.0 | 0.0 | 149.0 | |
| Remote Weather Station Records (provided by WCRC with thanks) | |||||||||||
|---|---|---|---|---|---|---|---|---|---|---|---|
| Station | Update Time | Last Hour | Last 6hrs | Last 24hrs | Last 7 Days | ||||||
| Upper Styx River | 08/07/2026 (15:00) | 0.0 | 0.0 | 0.0 | 0.0 | ||||||
| Lower Taipo River | 29/09/2025 (02:00) | 3.0 | 18.0 | 25.0 | 117.0 | ||||||
| Annual Weather Records | |||||
|---|---|---|---|---|---|
| Parameter | Max | Max Date | Min | Min Date | Average |
| Wind Speed (kmph) |
111 | 20/6/26 | 0 | 1/1/26 | 3 |
| Wind Gust (kmph) |
111 | 20/6/26 | 0 | 1/1/26 | 22 |
| Wind Chill (ºC) |
26.7 | 11/2/26 | -5.2 | 26/6/26 | 8.7 |
| Humidity (%) |
100 | 1/1/25 | 99 | 1/1/25 | 99 |
| Temperature (ºC) |
26.7 | 11/2/26 | -3.4 | 18/5/26 | 9.0 |
| Barometer (mb) |
1039.50 | 16/5/26 | 979.35 | 24/1/26 | 1013.81 |
The following graphs show a 72 hour (3 day) history of Temperature, Humidity, Windspeed, High Wind Gust, Wind Direction, Wind Chill, Rainfall, Barometric Pressure and Dew Point. The displayed graph interval is 30 minutes (eg. rainfall is displayed at mm/30min).